Debating the Great Lockdown

Early assumptions of extraordinary SARS-CoV-2 infectiousness and lethality have proven fallacious. Some are already calling the coronavirus lockdown “the Greatest Mistake in History.”
The seductive numerical precision of the Imperial College London (ICL) March 16 model, with grim forecasts of deaths in the tens of millions, provoked a herd-like panic across the world but was refuted by data collected in the following weeks that progressively reduced its policy usefulness. Early modelling of the virus was based on the initial statistics from Wuhan and Italy. Indeed, with the significant number of asymptomatic cases, the most common symptom of the virus is no symptom at all. But has the Great Lockdown worked? Cross-jurisdiction comparisons are notoriously difficult and it’s almost impossible to prove lives have been saved except by falling back tautologically on the model’s own projections of mortality figures with no lockdown. It’s easier to raise questions about the claimed success.
Countries with different lockdown strategies show broadly similar coronavirus curves. The model, based not on science but flawed assumptions and skewed data, has failed badly in its predictions of the evolution of the curve. Chris von Csefalvay, an epidemiologist who specialises in the virology of bat-borne illnesses, including coronaviruses, examined the code behind Neil Ferguson’s model after ICL eventually and reluctantly shared a cleaned up version. He concluded its flaws fall “somewhere between negligence and unintentional but grave scientific misconduct.”
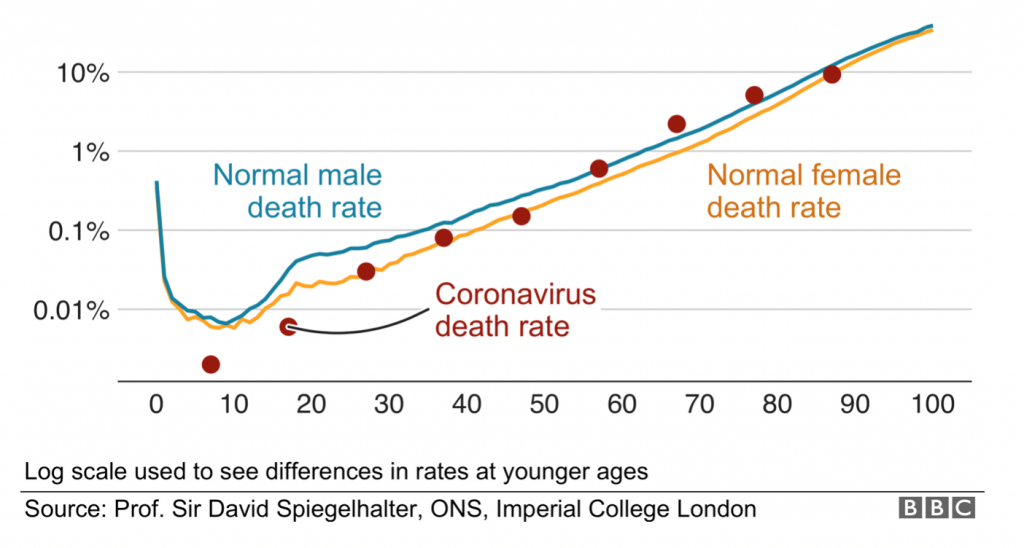
Across the entire population, mortality figures are within the seasonal fluctuations of flu. But unlike the flu, which tends not to discriminate between different age cohorts, coronavirus is very age-specific. The elderly, with comorbidities like heart and lung diseases, obesity, and other diseases associated with old age, are significantly more at risk. The strong association with comorbidities means that even for the elderly, coronavirus per se does not pose a significantly higher risk of death. This is shown in a visually striking age-adjusted graph from the BBC on 6 May. For those under 20, the graph suggests the risk is negligible. Perhaps most surprisingly, children under 10 do not appear to be transmitters of the disease. Thus a boy with coronavirus did not pass it on to 170 contacts, but he did cross-infect two siblings with the common cold and flu. In New York, two-thirds of new hospital admissions were infected at home while sheltering-in-place. Prolonged exposure in enclosed environments like households is high risk; in outdoor settings the risk is under 5 percent. In the UK, the “vast majority” of patients had no coronavirus symptoms on admittance but picked up the disease in the hospital.
Risk of dying each year by age in Great Britain

Source: BBC
The obsession with the coronavirus has meant a neglect of other preventive screening and therapeutic interventions, producing significant numbers of excess deaths from other causes. The Guardian reported on 9 May 6,546 more non-COVID-19 deaths at homes across Britain compared with the seasonal five-year average. Professor Karol Sikora, a consultant oncologist with the National Health Service, estimates up to 50,000 more UK deaths from cancer owing to the lockdown-induced pause in health screenings. The German magazine Tichys Einblick claims it’s obtained an 86-page official report, an unofficial translation of which says the lockdown measures “apparently cost more lives, for example of cancer patients, than of those actually killed” by COVID-19. Australia’s top mental health experts warn that a lockdown-induced 50 percent jump in suicides could kill ten times as many as the virus.
“R” is defined as the mean number of people cross-infected by one case. It is the magic number informing all epidemiological models of the likely progression of the virus under different scenarios and how to keep it below 1, the threshold at which infections grow in the overall population. A good example of the R number falling below 1 before a lockdown was imposed and staying so throughout comes from Germany. This chart from the Robert Koch Institute shows that by 23 March, when the most severe lockdown measures were imposed, R was already below 1 and in the following weeks did not decline any further. Thus the lockdown seems to have made no appreciable difference to R.
Germany’s infection curve 1 March–10 May 2020

Source: Robert Koch Institute, Berlin
The geography of coronavirus
Geography seems a far more striking feature of the variance than lockdown and other policy interventions. For reasons as yet unknown, coronavirus has hit Europe and the US (especially New York) particularly hard, while Asia and the Pacific have thus far been spared its worst ravages. Europe and North America combined host only 14 percent of the world’s population but account for 75 and 86 percent of the world’s total coronavirus cases and deaths, respectively. By contrast Asia, with 60 percent of the world’s population, accounts for just 16 percent of infections and 8 percent of deaths to date, while Africa’s shares are 17, 1.5 and 0.8 percent, respectively. One line of speculation looks at the possibility that Europe and the US have been hit by a particularly virulent mutation of COVID-19. No doubt the scientific explanation will come in due course.
There are two striking European examples to date of observational data that contradict the dominant epidemiological model. Belarus has been ruled by a dictator since 1994. President Alexander Lukashenko has dismissed COVID-19 panic as a “psychosis,” rejected lockdown and social distancing measures, and refused to close schools and cancel football matches. On 1 April, a WHO official warned that Belarus was entering a “concerning” new phase and urged the imposition of new measures to control the infection, but was rebuffed. By 20 May, Belarus had just 179 COVID-19 deaths.
The best-known example of a country bucking the model is Sweden. An application of the ICL model to Sweden (Figure 4 on p. 29) projected that, without a lockdown instituted by 10 April, between 70,000 and 90,000 people would die by mid-May. The actual total on 20 May was 3,831 – significantly higher than Sweden’s Nordic neighbours but far lower than most of Europe. The two points of comparison are likely to be among the most watched over the next year.
Targeted interventions vs blunderbuss lockdowns
A study for the US National Bureau of Economic Research compared age-specific relative risks of infection, hospitalisation, and death. Its overall conclusion: “semi-targeted policies that simply apply a strict lockdown on the oldest group can achieve the majority of the gains from fully-targeted policies.” This also avoids the perverse health consequences, extraordinary economic costs, and draconian curtailment of individual freedoms.
A one-size-fits all approach dissipates effort, distracts from the age-specific measures for the elderly as their special needs get lost in the noise, and, by harming the economy, diminishes the resources we have as a society to protect the most vulnerable. The cluster in Sydney’s Newmarch House, with over 15 coronavirus deaths, is what happens when care is diffuse and generalised instead of focussed and targeted. Instead, governments should quarantine the elderly, direct more and better resources towards them (e.g. the quality of care in institutions and making sure they have opportunities to go outside in the sun and air while maintaining physical distancing), and be more cautious in reopening borders. Meanwhile, they should let the 20-60 age group get back to normal activity ASAP, and perhaps the 60-69 age group with a bit more watchful caution. Governments should the famous effective reproduction rate (R) carefully to keep it below 1 so the cases keep falling. Serological testing will allow us to measure the gradual spread of the infection across the population. The idea of a bubble with countries with comparable and better coronavirus success indicators is a good one, starting with Australia and New Zealand, but also including some other regional neighbours.
Herd immunity, not herd mentality
A team of scientists from Edinburgh and London has suggested a segmenting-and-shielding strategy that segments the elderly and frail while shielding their carers with adequate personal protective equipment as a means to exit the lockdown with minimal risk of an overpowering second wave of infections. It is adapted from the “cocooning” of infants by immunisation of close family members that is a pillar of infection prevention and control strategies. This is the essence of the Swedish “model”: protect the vulnerable, allowing the virus to spread slowly, within the ICU bed capacity, through the healthy population and thereby build herd immunity across the country. According to Swedish chief epidemiologist Anders Tegnell, “The more people become immune, the slower the spread of the virus in a population.” The key to the herd immunity strategy is it acknowledges that the virus is serious and unstoppable, but that most people will come through fine if the vulnerable are sheltered and the seriously ill are hospitalised.
Infection curves have been falling in countries with and without hard lockdowns. One hypothesis advanced by Nicholas Lewis is that the herd immunity threshold might be as low as 7-24 percent rather than the 50-60 percent of the ICL model. The latter threshold would overwhelm Australia’s health system; the former makes herd immunity a manageable strategy. Prime Minister Scott Morrison may not like the term, but unless we want a permanently drawn-up moat around Australia’s shores, one way or another the only long-term viable solution is herd immunity by a combination of natural infection-cum-survival and then mixing into the general population, and vaccination. The latter may never arrive: not all past coronaviruses have a vaccine. On 14 May WHO emergencies expert Mike Ryan told an online briefing: “this virus may become just another endemic virus in our communities, and this virus may never go away.”
In retrospect, Australia could have used the good fortune of the virus arriving the latter part of its summer, instead of in the middle of the flu season as in the northern hemisphere, firstly to boost surge capacity at every bottleneck point to test, isolate, trace and treat cases; and secondly to follow the Swedish model with greater success and lower overall cost to lives, mental health, and the economy. After all, chief medical officer Brendan Murphy conceded during a press briefing on 24 April that Australia’s “R” was under 1 in every state and territory in mid-March, before the stage 3 lockdowns took effect on 30 March.
Ramesh Thakur FAIIA, a former Assistant Secretary-General of the United Nations, is Emeritus Professor of the Crawford School of Public Policy at The Australian National University. He is Director of the Centre for Nuclear Non-Proliferation and Disarmament and co-convener of the Asia-Pacific Leadership Network for Nuclear Non-Proliferation and Disarmament.
This is part two of a two-part article on the need for a more moderated response to the pandemic. “Lockdowns Can Be Cruel, Heartless, and Deadly” was published on 15 May, 2020.
This article is published under a Creative Commons Licence and may be republished with attribution.


